When we develop microservice application, we usually divide microservices according to business logic, and call each business through REST. A user operation may require the cooperation of many microservices to complete. If any microservice has problems or the network times out, it will cause the function to fail. With more and more services, the analysis of the call chain between microservices will become more and more complicated.
Spring Cloud Sleuth provides link tracking for calls between services. Through Sleuth, you can clearly understand which services a request has passed, and how long each service process takes, so that we can easily sort out the calling relationship between microservices. In addition Sleuth can help us:
- Time-consuming analysis: with
Sleuthwe can easily understand the time-consuming of each sampling request, so as to analyze which service calls are time-consuming; - Errors visualization: for exceptions not caught by the program, you can see them through the integrated
Zipkinservice interface; - Link optimization: For services that are called frequently, some optimization measures can be implemented for these services.
Sleuth+Log Example
We first integrate Sleuth in the simplest way and output the information tracked by Sleuth to the log.
Modify Product-Service-Consumer
Add bootstrap.properties file
In order to enable the log file to obtain the service name, we need to move part of the original configuration in application.properties into the bootstrap.properties configuration file. This is because Spring Boot will preferentially scan the bootstrap configuration source when starting, so that the log can get the service name.
1 | server.port=9090 |
Modify application.properties
1 | eureka.client.service-url.defaultZone=http://localhost:8761/eureka |
Note here to modify the log level of DispatcherServlet to DEBUG.
Modify Logback configuration file
Add a file named logback-spring.xml to the resources directory with the following content:
1 |
|
Add dependency
1 | <dependency> |
As mentioned in the SpringCloud reference manual:
SLF4J MDCis always set automatically, and if logback is used, the trace/span id is immediately displayed in the log. Other log systems need to be configured to achieve this effect. The defaultlogging.pattern.levelis set to%clr(% 5p)%clr([${spring.application.name:},%X{X-B3-TraceId:-},%X{X-B3-SpanId: -},% X {X-Span-Export:-}]) {yellow} (This is also a feature ofSpring Bootwhen integrating logback). This means that if you do not need to manually configure the format when using SLF4J, other log systems must be manually configured, otherwise they will not be output.
Modify Product-Service
Same as above
Test
Start the Service-discovery, Product-Service, and Product-Service-Consumer in order. Visit: http://localhost:9090/products. Then we observe the log output in the Product-Service-Consumer and Product-Service consoles, and we can see output similar to the following:
1 | 2020-02-16 22:14:14.937 DEBUG [PRODUCT-SERVICE,71fb907c61436aff,d572b78867aa38a1,false] 3422 --- [nio-2100-exec-2] o.s.web.servlet.DispatcherServlet : GET "/products", parameters={} |
1 | 2020-02-16 22:14:15.012 DEBUG [PRODUCT-SERVICE-CONSUMER,71fb907c61436aff,71fb907c61436aff,false] 3428 --- [nio-9090-exec-1] o.s.web.servlet.DispatcherServlet : Completed 200 OK |
The format of the log content is: [appname, traceId, spanId, exportable], which is Sleuth‘s trace data. among them:
- appname: the service name of the microservice;
- traceId/spanId: Two terms for Sleuth link tracking. We will introduce them in detail later.
- whether exportable is sent to Zipkin.
Sleuth Terminology
Because Sleuth is based on Google’s Dapper’s paper, it also borrows Dapper in terminology.
- Span: The most basic unit of work. For example: Sending an RPC is a new
span, and so is an RPC response.Spanuses a unique 64-bit ID for identification. In addition, a 64-bit ID is used for service call tracking.Spancan also carry other data, such as: description, timestamp, tag of key-value pair, ID of startingSpan, and processing ID (usually using IP address), etc.Spanhas start and end, they are used to track time information.Spanshould appear in pairs, beginning and ending, so once aspanis created, it must be ended at some point in the future.
Note: The starting span is usually called the:
root span. Its id is usually used as the id of a track record.
Trace: A tree-structured
Spancollection. For example: In a distributed big data store, each request may be a tracked record.Annotation: Used to record the time information of an event. Some basic core annotations are used to record the start and end time of the request, for example:
- cs: short for
Client Sent. This annotation indicates the start of a span; - sr: short for
Server Received. Indicates that the server receives the request and starts processing. The network transmission time can be calculated by subtracted thecs - ss: the server completes the request processing, and the response information is sent back to the client (abbreviation of
Server Sent). If you subtract thesrtimestamp, you can calculate the time it takes for the server to process the request. - cr: short for
Client Received. Marks the end ofSpan. The client successfully received the response from the server. The response time of the request can be calculated by subtract thecs.
- cs: short for
The following figure(https://cloud.spring.io/spring-cloud-sleuth/reference/html/) describes the concepts of Span and Trace in a visual way:
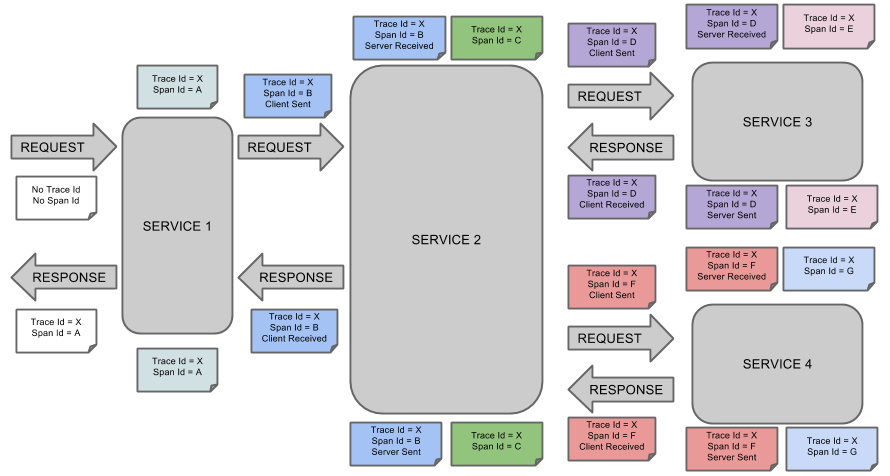
Each color in the picture represents a span (a total of 7 spans, from A to G). They all have the following data information:
1 | Trace Id = X |
Which means he Trace-Id of the Span is X, and Span-Id of the Span is D, The corresponding event is Client Sent.
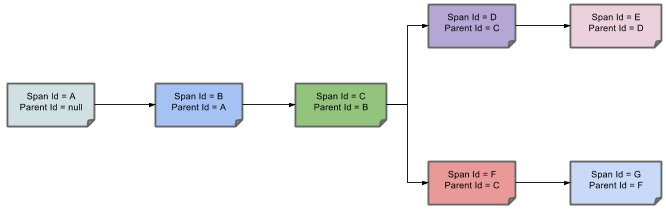
The subordinate relationships of these spans can be represented by the following figure (https://cloud.spring.io/spring-cloud-sleuth/reference/html/):
Integrate Zipkin services
Zipkin is a distributed tracking system dedicated to collecting time data for distributed services. It mainly involves the following four components:
- collector: data collection;
- storage: data storage;
- search: data query;
- UI: Data display.
Zipkin provides pluggable data storage methods: In-Memory, MySql, Cassandra, and Elasticsearch. The next test is to conveniently use the In-Memory method for storage. I personally recommend Elasticsearch, especially when we need to integrate ELK in the future.
Zipkin‘s source code on Github is: https://github.com/openzipkin/zipkin.
Zipkinrequires JDK8 support.
In this article, we only provide tracking data to Zipkin through Http. I will explain it later when we talk about Spring Cloud Bus using the stream method.
1. Zipkin-Server
Note that now custom zipkin server is no longer supported. Refer to Quick-start for starting the zipkin server instance.
1 | curl -sSL https://zipkin.io/quickstart.sh | bash -s |
The default address is: http://localhost:9411/zipkin/.
2. Modify Product-Service-Consumer
Modify pom.xml
Add dependency:
1 | <dependency> |
And remove:
1 | <dependency> |
This is because spring-cloud-starter-sleuth dependency is already included in spring-cloud-starter-zipkin.
Modify application.properties
Add the following to application.properties:
1 | spring.zipkin.base-url=http://localhost:9411 |
spring.zipkin.base-url specifies the address of the Zipkin server, spring.sleuth.sampler.percentage sets the sampling ratio to 1.0, which is all required. About sampling can refer to the later description.
Modify Product-Service
Same as above
Test
Start the Service-discovery, Zipkin-Server, Product-Service, and Product-Service-Consumer projects in order.
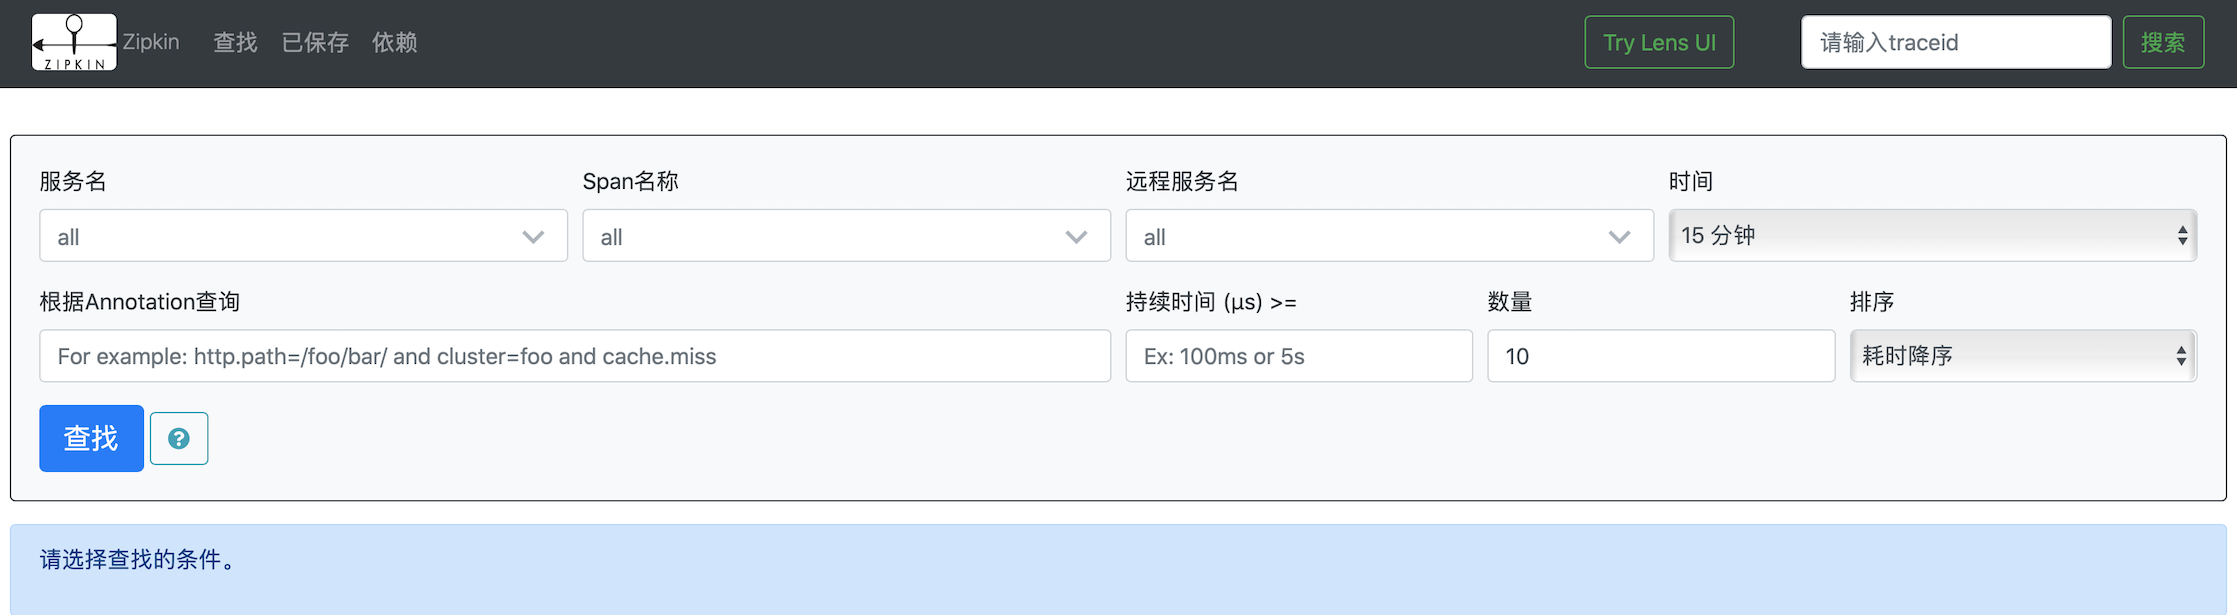
Check Zipkin server
Visit: http://localhost:9411, can see the following:
Visit Product-Service-Consumer to generate service calls
We visit the service provided by Mall-Web several times in the browser, and then go to the Zipkin server, you can see the following interface:
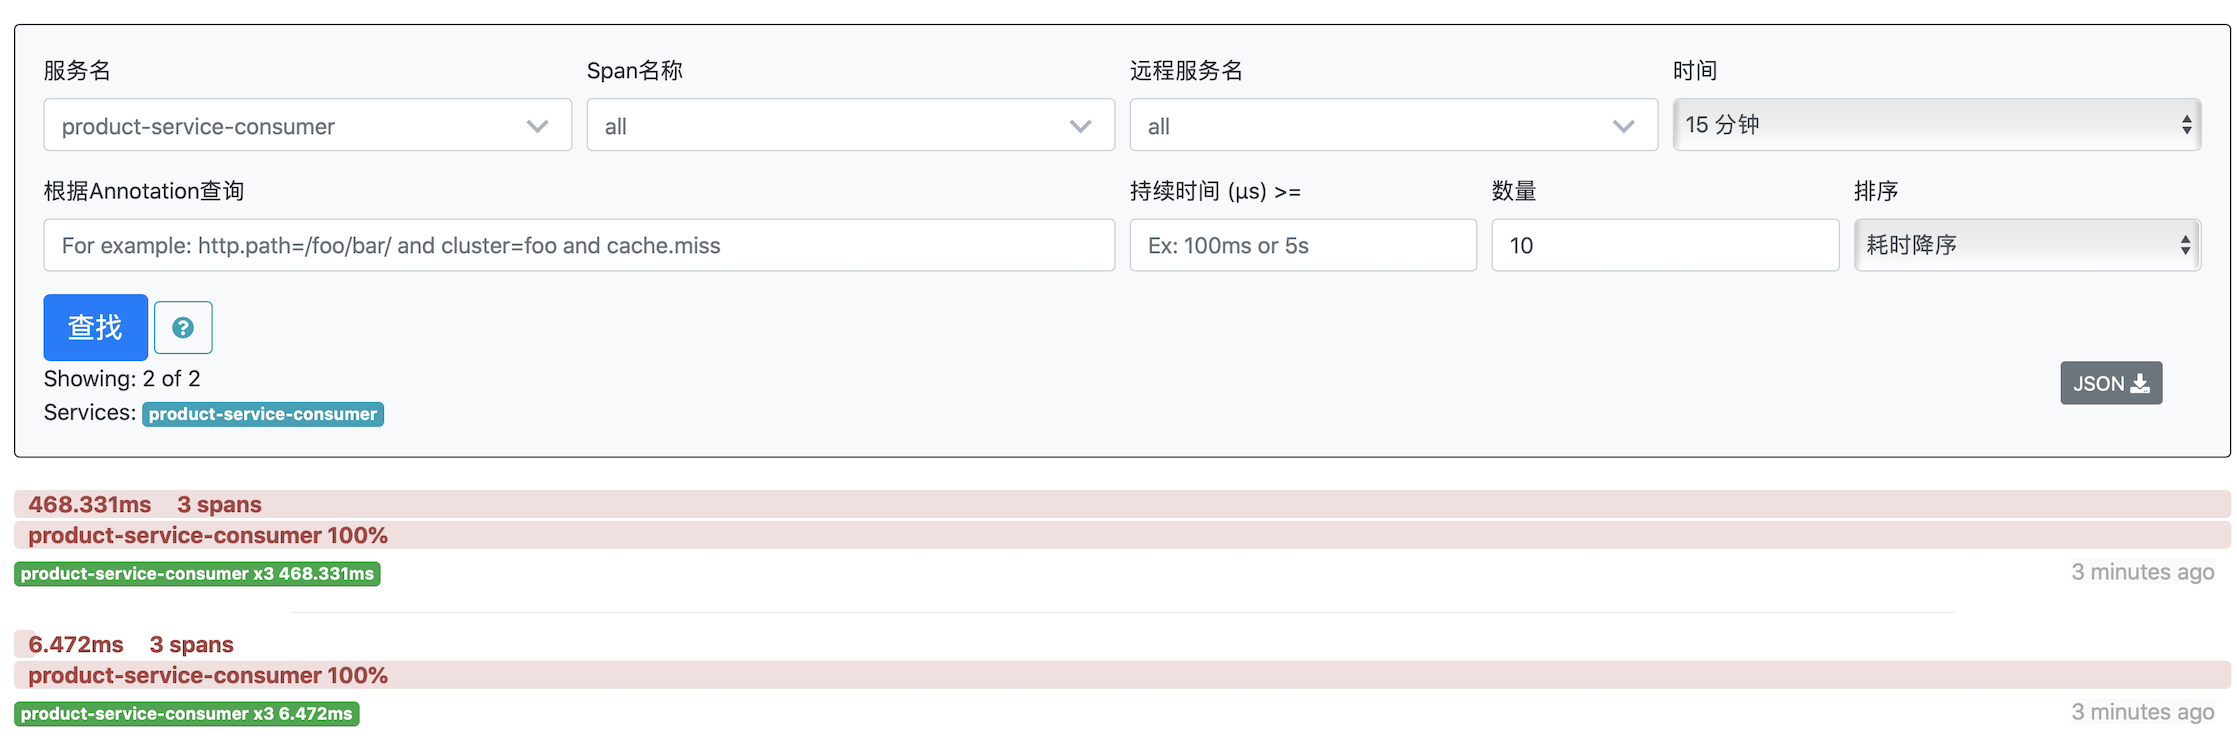
We can see that Zipkin has obtained several service call tracking information. We can click on one of these requests and see the following interface:
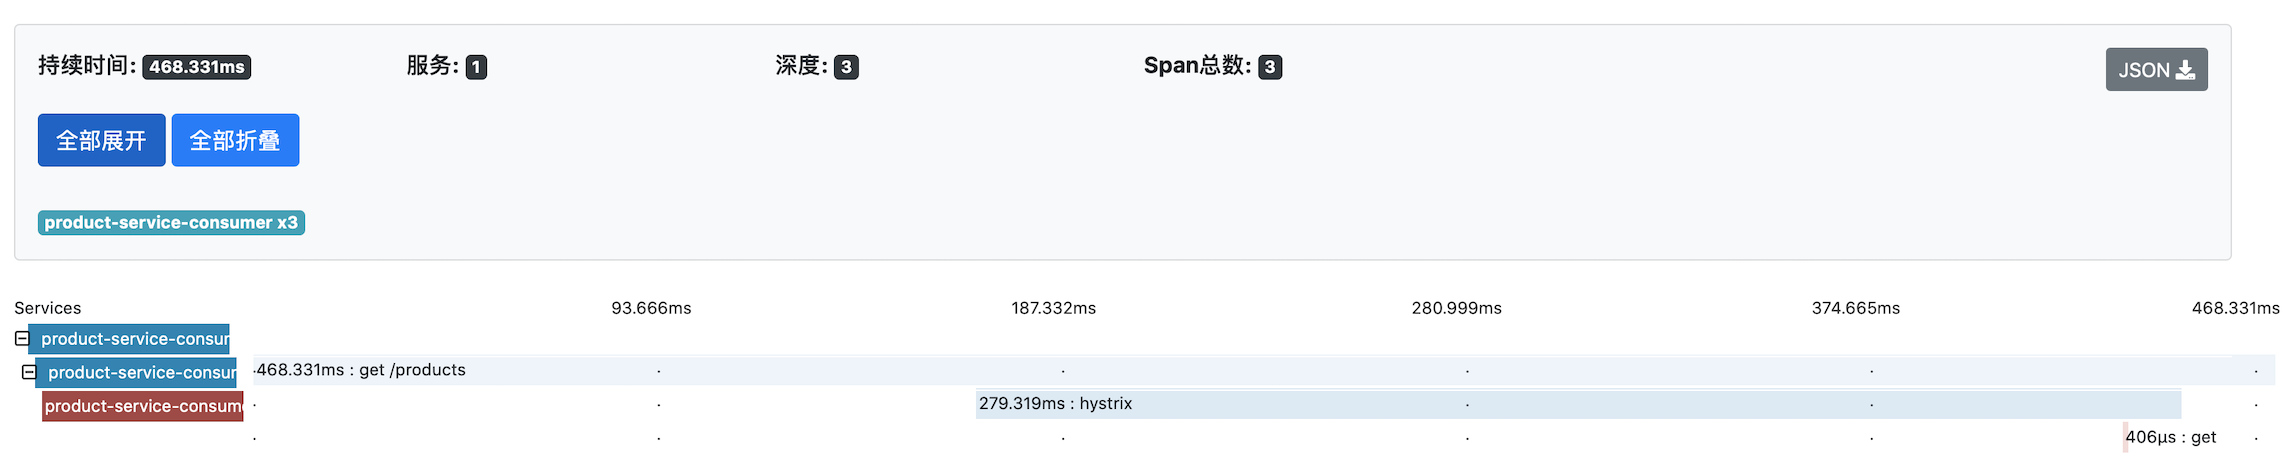
This interface presents the request in more detail. Similarly, we can click again to view more detailed data, we can see the following interface:
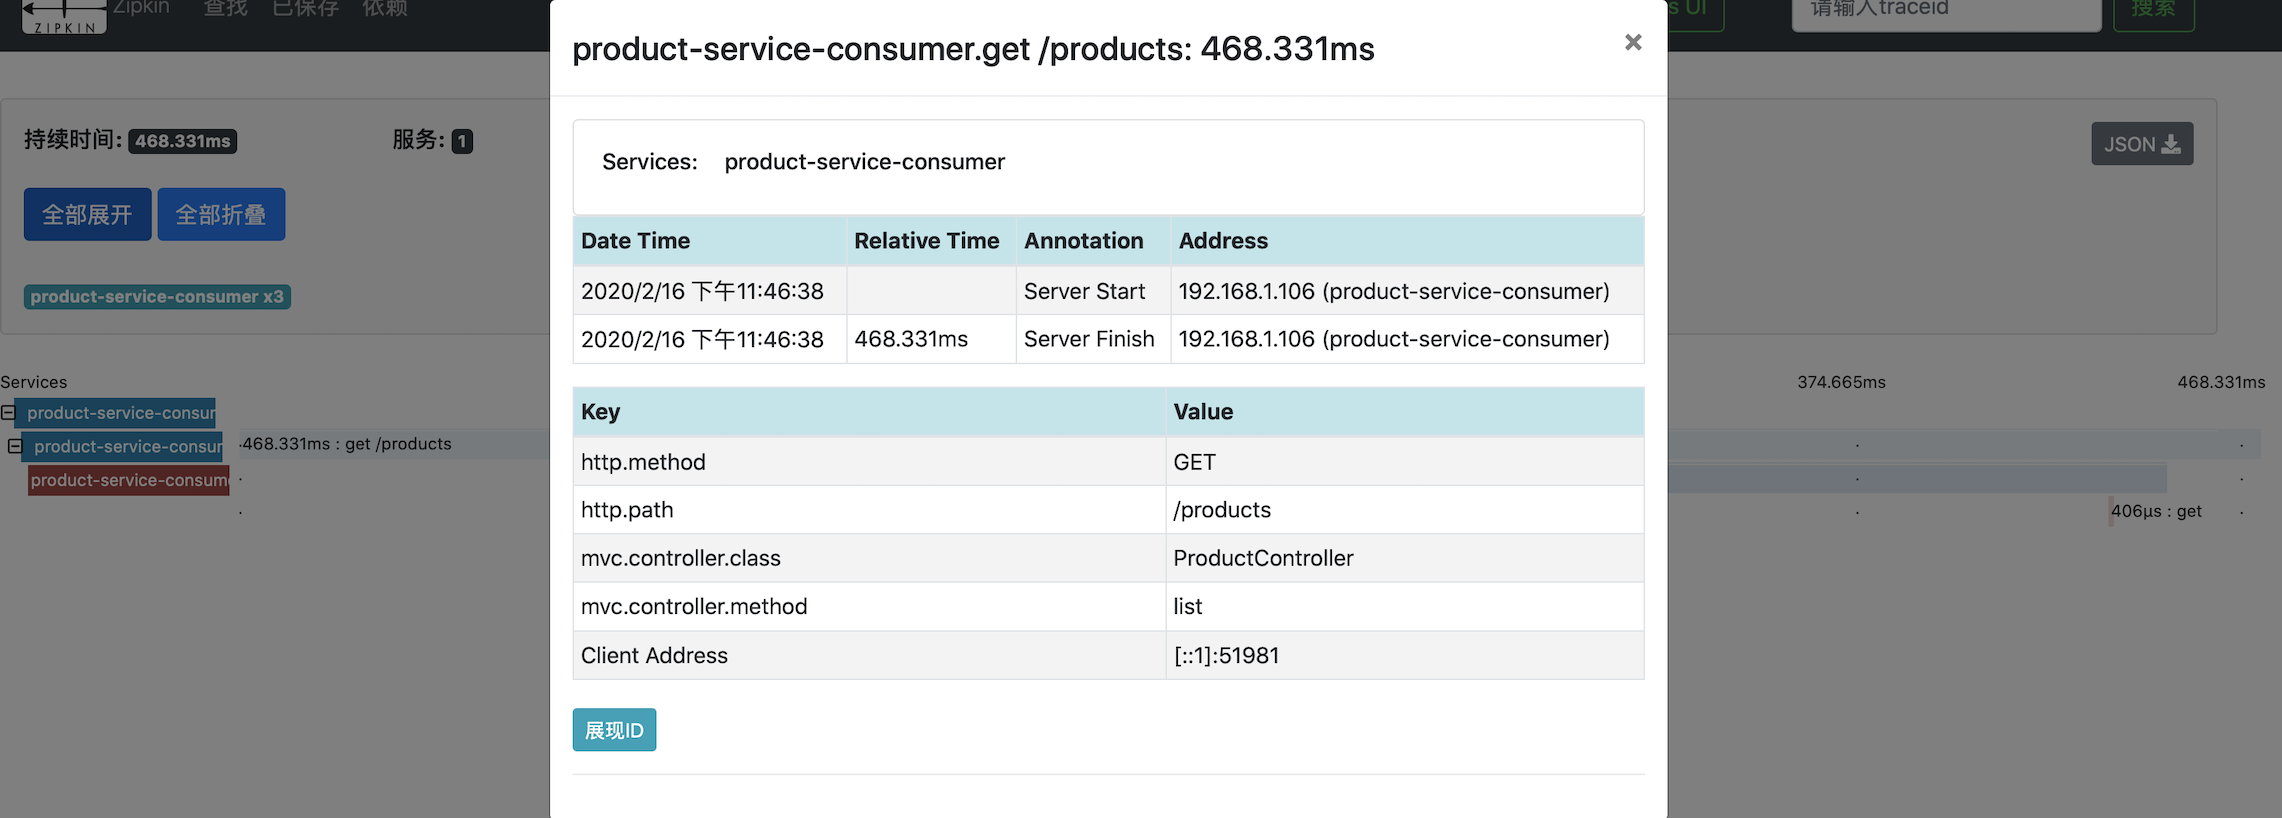
In this interface we can see the various time tracking information mentioned earlier.
In the Zipkin interface, we can also click Dependencies to view the dependencies between services, as shown below:

Error message
Zipkin can display error messages in trace records. When the exception is thrown and not caught, Zipkin will automatically change colors. In the list of trace records, when you see the red record, it means that an exception was thrown. As shown in the first figure above, the error message is displayed based on the data. We can also click into it for more detailed error information.
Check out the source code here: Sleuth demo