When implementing the microservice architecture, we usually split the services into individual microservices, and the microservices communicate through the network and call each other, resulting in a dependency relationship between them. We know that due to network issues, the service does not guarantee 100% availability. If there is a problem with a single service, there will be network delay or even call failure when calling this service, and the call failure will cause the user to refresh the page and try again. This, coupled with other service calls, increase the load on the server, causing the service to be unavailable, and eventually lead to a crash of the entire service.
To solve this problem Netflix created Hystrix library based on the circuit breaker pattern. “Circuit breaker” itself is a switching device. When a service fails, the fault monitoring of the circuit breaker (similar to a blown fuse) returns the service caller with an expected, manageable alternative response (FallBack), rather than waiting for a long time or throwing an exception that the caller cannot handle. This guarantees that the thread of service caller will not be occupied for a long time and needlessly, thereby preventing the fault from spreading in the whole distributed system.
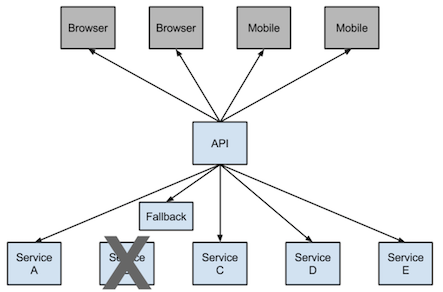
Of course, when the frequency of request failures is low, Hystrix will still return the failure directly to the client. Only when the number of failures reaches the threshold (defaults to 5 failures within 20 seconds), the circuit breaker opens and does not perform subsequent communication, but directly returns a fallback response.
Example Project
Feign integrates the Ribbon and Hystrix by default, so we modify the code based on the previous article Spring-Cloud-6-Fault-Tolerant-Hystrix.
It is the service consumer that implements the microservice fault tolerance protection, which is the service-product-consumer project. Our code are mainly changing the service-product-consumer project, the code of other projects will remain unchanged.
1. Hystrix Dependency
1 | <dependency> |
2. Main Application
1 |
|
Add @EnableCircuitBreaker annotation to enable circuit breaker support.
3. Implement ProductService Fallback
Add a concrete class to implement ProductService interface.
1 |
|
4. Enable ProductService to have fault tolerance
1 | (value = "PRODUCT-SERVICE", fallback = ProductServiceFallback.class) |
Just need to add fallback configuration to @FeignClient annotation, and set it to the fallback class ProductServiceFallback.
Enable Hystrix on Feign
Add the following configuration to application.properties.
1 | feign.hystrix.enabled=true |
5. Fault Tolerance Testing
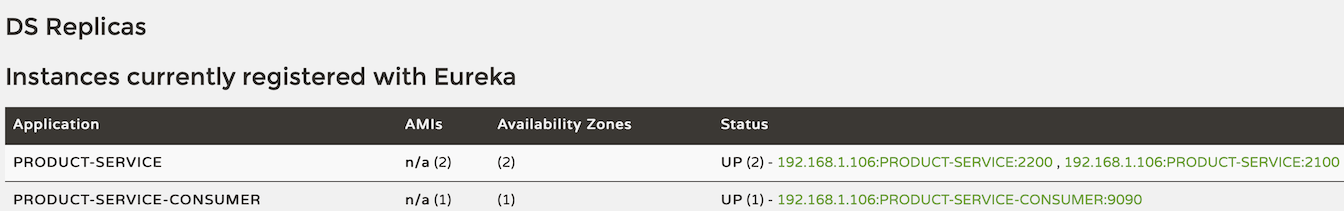
First, we start
Eureka Server, twoPRODUCT-SERVICEandPRODUCT-SERVICE-CONSUMER. After starting, we can see the registered services in the monitoring interface ofEureka Server:![]()
Visit: http://localhost:9090/products/item-3.
![]()
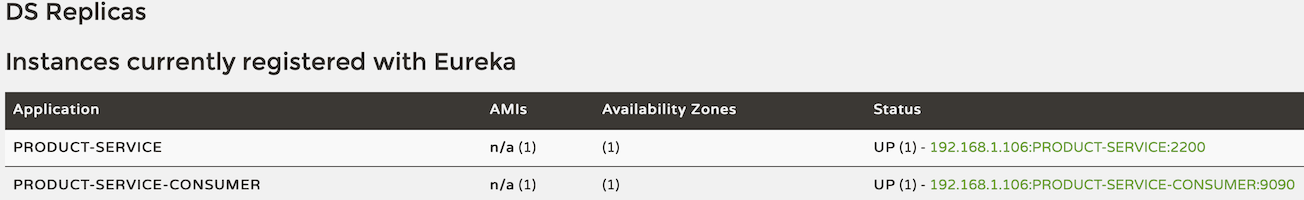
Means our service call is success.Now We stopped the
PRODUCT-SERVICEservice with port 2100. At this time, we can see that the registered services are as follows in the monitoring interface ofEureka Server, indicating that one of thePRODUCT-SERVICEhas been down, and at this time, we can still get the correct response by visiting: http://localhost:9090/products/item-3:![]()
We continue to stop the
PRODUCT-SERVICEservice with port 2200. At this time, we can see that the registered services are as follows. Note that allPRODUCT-SERVICEservices have been down. At this time, if we visit: http://localhost:9090/products/item-3, we will see the fallback response:![]()
![]()

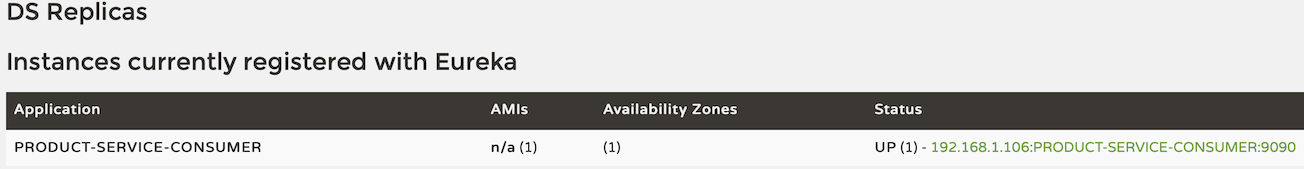

It can be seen that FallBack has been activated. When all PRODUCT-SERVICE does not work, the ProductService in PRODUCT-SERVICE-CONSUMER has entered a fallback process.
Hystrix Fault Tolerance Principle
Request encapsulation: Whether it is HystrixCommand or HystrixObervableCommand, you can see from the class name that Hystrix actually uses “command mode”. The command mode is used to encapsulate service call, and each command is executed in a separate thread;
Trip mechanism: When the error rate of a service exceeds a certain threshold (default 5 failures within 20 seconds), Hystrix can automatically or manually perform a service trip and stop requesting the service for a period of time;
Resource isolation: Hystrix maintains a small thread pool for each service dependency. If the thread pool is full, requests to the service will be rejected immediately instead of waiting in a queue, thereby speeding up the determination of service failure;
Service monitoring: Hystrix can monitor operational indicators and configuration changes in near real time, such as the success, failure, timeout, and rejection of requests;
Fallback mechanism: When the request fails, times out, rejected, or when the circuit breaker is opened, the corresponding fallback logic is executed;
Self-healing: When the circuit breaker is opened for a period of time, Hystrix will enter a “half open” state. The circuit breaker will allow a request to try to make a request to the service. If the service can be successfully called, close the circuit breaker, otherwise the circuit breaker will continue turn on.
Hystrix Monitoring
In addition to implementing service fault tolerance, Hystrix also provides monitoring of service requests: the number of requests executed per second, the number of successes, and so on. Enabling monitoring of Hystrix is very simple. One is to add spring-cloud-starter-netflix-hystrix. The other is to add spring-boot-starter-actuator, which enables the / hystrix-stream endpoint to obtain monitoring data from Hystrix.
Use Spring Boot Actuator
1. Add dependency
1 | <dependency> |
2. application.properties
1 | management.endpoints.web.exposure.include=hystrix.stream |
3. Testing Monitor
After starting PRODUCT-SERVICE-CONSUMER, and call the service: http://localhost:9090/products/item-3. Then visit: http://localhost:9090/actuator/hystrix.stream:
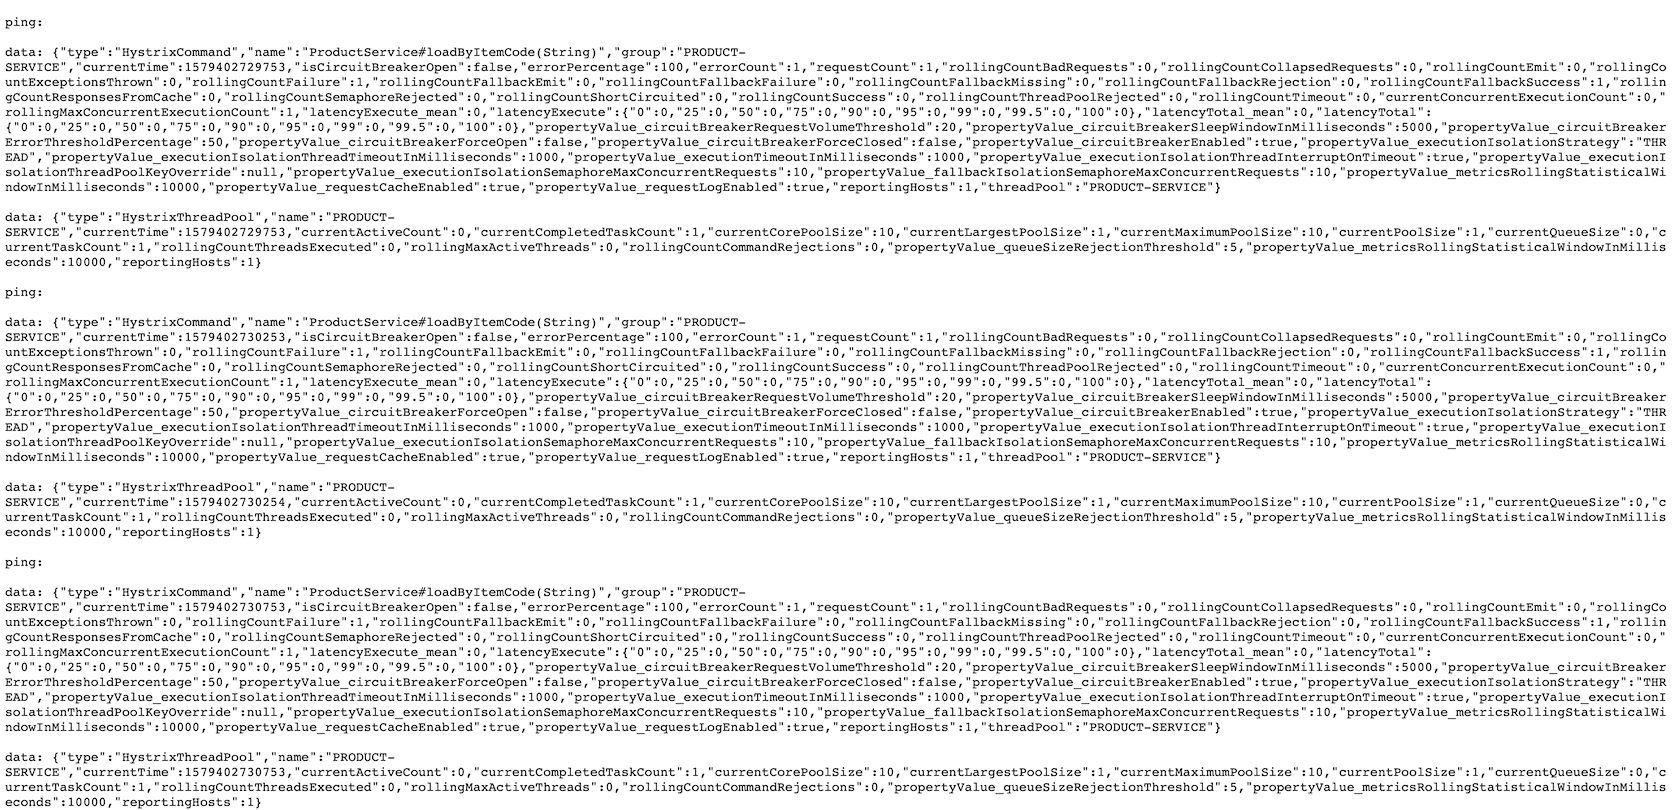
We can see that the page will repeatedly output some statistics. It is very hard to read the data. Fortunately, Hystrix provides us with a visual interface to view these data.
Hystrix Dashboard
We can integrate Hystrix Dashboard with PRODUCT-SERVICE-CONSUMER
1. Dependency
1 | <dependency> |
2. Main application
1 |
|
Add @EnableHystrixDashboard annotation to enable Hystrix Dashboard.
3. Start service
Start PRODUCT-SERVICE-CONSUMER. Visit: http://localhost:9090/hystrix:
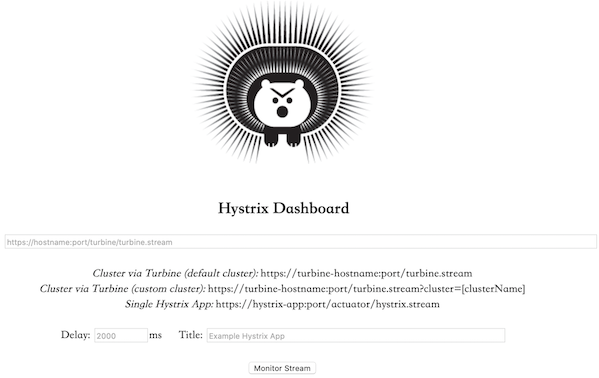
The Dashboard has been started successfully. Then enter the previous address in the interface: http://localhost:9090/actuator/hystrix.stream, and then click [Monitor Stream] to see the statistics report page:
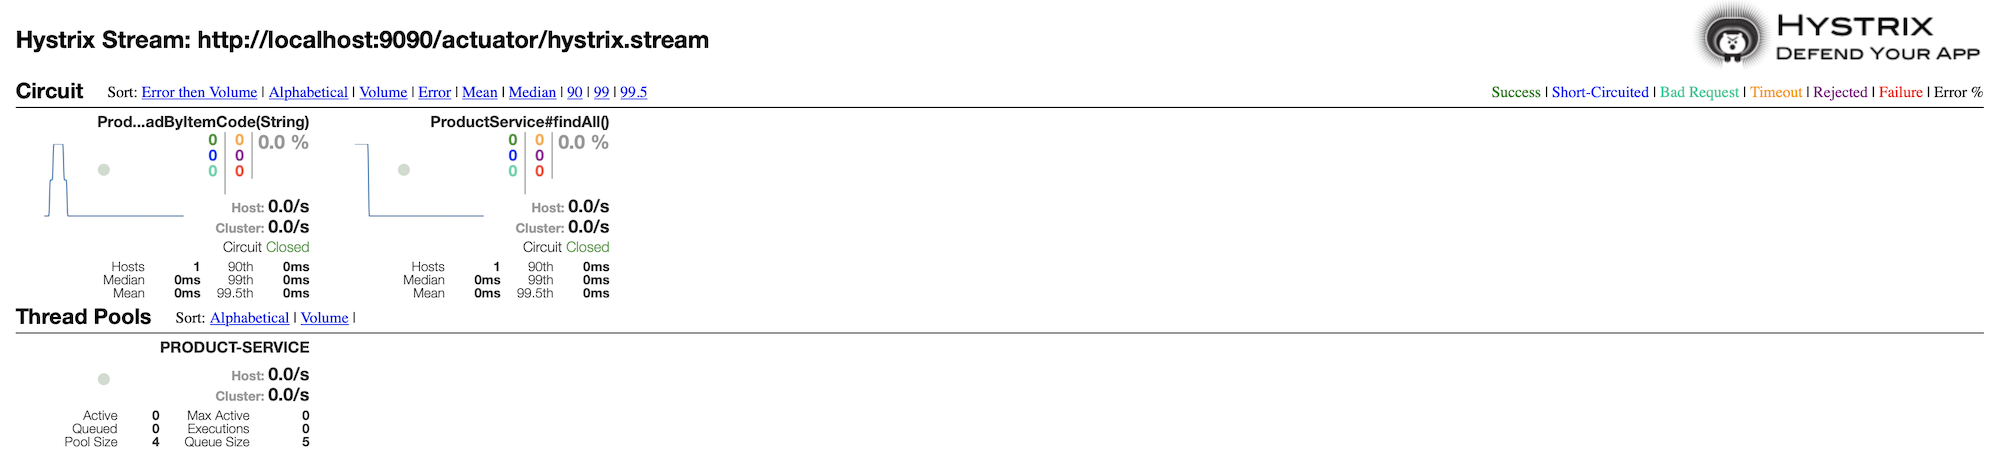
We can see statistics for two service interfaces: findAll and loadByItemCode.
The statistical information of each method contains two important graphical information: a solid circle and a curve.
Solid circles: Two indications. The color indicates the health of the instance, which decreases from green, yellow, orange, and red. The size changes according to the size of the requested traffic. The larger the traffic, the larger the solid circle, and vice versa.
Curve: Statistics about the change of request traffic within 2 minutes, and the curve can be used to analyze the rising and falling trends of the traffic.
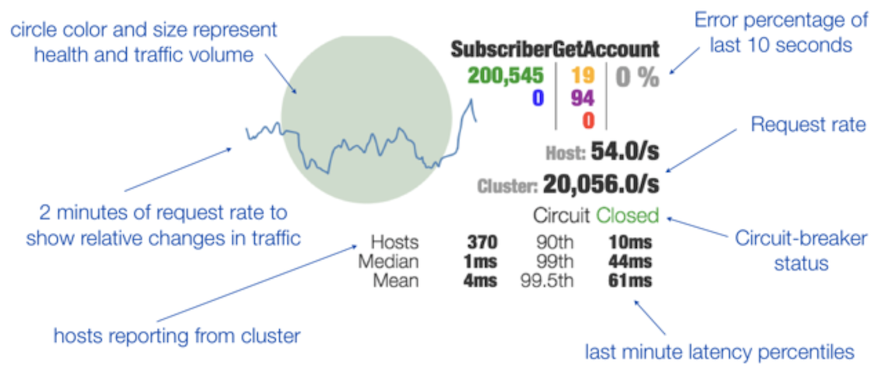
The meaning of the numbers in the interface is as follows (image from https://github.com/Netflix-Skunkworks/hystrix-dashboard/wiki):
On the Dashboard homepage, we know that Hystrix Dashboard supports three monitoring methods:
Default cluster monitoring: via http://turbine-hostname:port/turbine.stream, monitor the default cluster;
Specified cluster monitoring: via http://turbine-hostname:port/turbine.stream?Cluster=[clusterName] to monitor the specified clusterName cluster;
Single-machine application monitoring: http://hystrix-app:port/hystrix.stream to achieve monitoring of a service instance.
The above example demonstrated the third way.
Check out the source code here: hystrix demo